
Rather, in a perfect world, a tool should be able to work with the hodge-podge of data that reflects our daily routine and aid in making sense of it.
We couldn't agree more.
Therefore, we designed the IntelliGantt Web Part to work not only with SharePoint Task and Project Lists, but with just about any list, including the least structured of all-- Custom Lists. This gives you the ability to work with the unruly but critical data already in use today and adds a dash of structure to help you organize a collaborative effort so you can finish tomorrow.
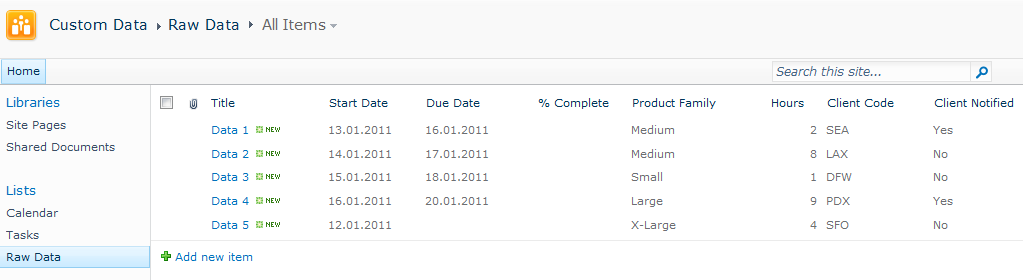
Take, for instance, this basic Custom List called 'Raw Data'. It probably came from a spreadsheet somewhere long forgotten.

That 'Client Notified' field indicates there's probaly some work behind updating these rows of data. It'd be great if we could lay it out in a real task oriented tool like the IntelliGantt Web Part.

Ideally, we would like to place the 'Raw Data' right into the task list as an additional project to view:

Happily, you can do just that!
First, we need to inform the IntelliGantt Web Part of the new list type we want to use. Every SharePoint list has a template id. In the Web Page Editor, the IntelliGantt Web Part has a text field you can add one or more template ids into.

The template id for a Custom List is "100", which makes me think it might have been the first list the SharePoint team ever created. We will add "100" to the field.

Click 'OK' to save your changes and when the IntelliGantt Web Part refreshes, lo and behold!

First, IntelliGantt Web Part found the 'Raw Data' because it matched the template id. Then it adapted to the data and view on that list and updated the column headers of the task list to match.
But we're not done yet. It's time to add our dash of structure to the mix. What we will do is add a few more fields and start whipping this data into shape.
First, let's go back to the 'Raw Data' list and open the List Settings.

Scroll down to the 'Columns' section in the List Settings. Here is where we can either add new columns or use columns already defined by SharePoint.

Why reinvent the wheel, right? Therefore let's go to the 'Add from existing site columns' and see what we find.
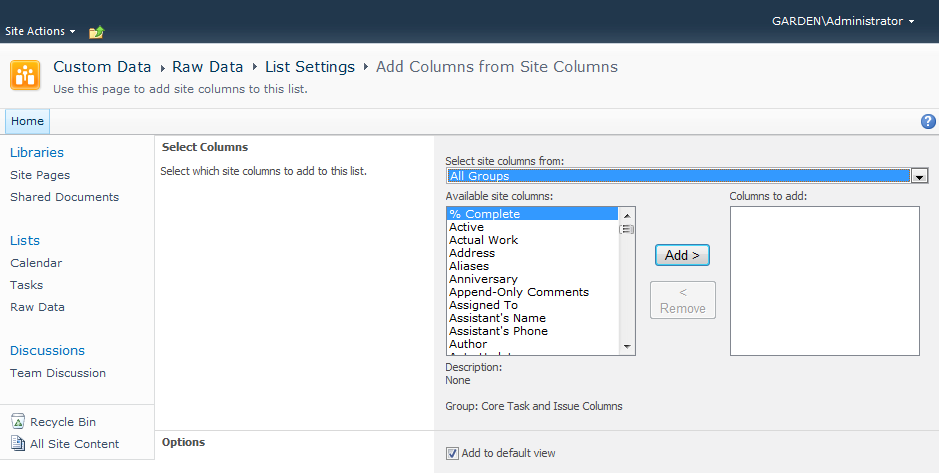
Looks like '% Complete' is at the top of the list. We can use that. And we will look for 'Start Date' and 'Due Date' as well.

Click 'OK' to add them and, upon return to the List Settings page, you should see these columns are now available in the 'Raw Data' Custom List.

While they where automatically added to the default view, let's change the order of the columns so we see the Start Date, Due Date and % Complete columns first.

OK, that wasn't too bad. Let's see what our IntelliGantt Web Part looks like now.

Excellent! Since this is a 'task aware' tool, we can quickly add a bit more structure to really help organize our data. For example, we can flesh out the Start and Due dates.

There, we've quickly applied a little bit of project management discipline to a formerly unstructured mess. Better yet, we did not have to examine and update each row of data in order to shoehorn it into an inflexible system. Instead, we brought a flexible (IntelliGantt!) system to the data and solved the problem.
By the way, everything is being stored in SharePoint and the simple updates we did to the Start and Due dates were saved in the 'Raw Data' Custom List.
If you have an unruly SharePoint dataset needing a bit of order, give the IntelliGantt Web Part a try today.


No comments:
Post a Comment