Monday, March 07, 2011

Passing URL Querystring to IntelliGantt Web Part

One of our design goals for the IntelliGantt Web Part was to make it easy for users AND for system integrators. For instance, we know how important a brand is so we reserve an area of the gantt chart to display a customizable name with a url link. Additional configuration options like colors, zooms, custom list IDs and more are available via the web part editor or passing parameters via the initParams string (our control being a good Silverlight citizen).

Then someone asked us 'can I pass configuration parameters with the url querystring?'

What a simple and powerful idea! Last Wednesday we said 'no', but today we can say YES!

We have created a table of all the parameters IntelliGantt recognizes. You can use these parameters via the initParams property if you've configured a 'Site Only' instance of the IntelliGantt Web Part, or you can pass these parameters to the SharePoint page housing the IntelliGantt Web Part via the url querystring and make things really dynamic.

The best example of this new capability is how you can now select a task list and view by placing information in the url querystring. Let's say I have a SharePoint site with two task lists: Tasks and Big Project. By default, the IntelliGantt Web Part finds all the task lists in your site and displays them:


Yes, we can either use the 'Exporer' to select just one project, or we can use the web part editor page to select a single project. But what if we could determine the list to show before-hand and construct a url with selected project and view information? Then we can actually plug the web part into a multi-step workflow process.

First, let's add a SelectListIDs value to the url so that just one project is selected. You can find a task list id value by first navigating to the task list:


and then going to the List Settings:


Once in the List Settings, notice that the url string in your web browser contains a querystring parameter of List=:


We can use this exact same list idea value in the querystring of the url of the IntelliGantt Web Part page. Rather than just 'List', we use 'SelectedListIDs' because we think it's clearer and we support multiple lists in the view. There, we create an url like so:


Finally, you can add multiple paramteters to the querystring just as you'd expect-- by concatenating them with the '&'. So, now that we've selected the right list, we can also select the view to use via the query string by appending the view name:


And voila, the task list and view for the IntelliGantt Web Part have been determined by the values in the querystring. What if the same parameter is defined in the web part editor? Then the web part editor value will take precedence. In order use the querystring parameter, make sure the corresponding field in the web part editor is blank.

As we add more configuration options to the IntelliGantt Web Part, we will make sure they can be set via the web part editor, the initParams or the querystring. This will ensure our design goal of making our web part as flexible for system integrators as possible.

Saturday, March 05, 2011

Selecting a Single Basecamp Project

Build 1.0.72 of the IntelliIGantt Web Part for Basecamp has a new feature we hope 'power users' will appreciate: the ability to identify a single Basecamp project in the url string.

I was online with a customer who wanted to view a specific project, but we had to wait for all projects to load before we could select a single project. This doesn't sound too bad, until you consider they had 100 projects. Kudos to 37 Signals for handling so many with aplomb. Now it was our turn to step up to the plate.

We took a look at the url used after clicking on a project from the initial dashboard. It looked something like this:


We thought 'we can use that'. So, if you copy the same url and place it into the IntelliGantt Web Part for Basecamp like so:


The IntelliGantt Web Part will then match that project and show that single project in its view.


You can still access any of the other projects by clicking on the Explorer (pith helmet). This will show you all projects with the current, single project selected for you:


Select any of the other projects and they will appear in your current view as well.

Saturday, February 19, 2011

IntelliGantt Web Part for SharePoint 2010 Sandbox

SharePoint 2010 introduces a 'Sandbox' mode that limits the scope of what a web part is able to do on the server. This is something of a curious feature for a Sliverlight-based web part such as the IntelliGantt Web Part because it doesn't do anything on the server-- it's only downloaded from the server and then runs on the client. In fact, here is the source code in its entirety for the IntelliGantt Web Part when built for sandbox mode:

public class IntelliGanttWebPartInstance : WebPart
{
protected override void CreateChildControls()
{
base.CreateChildControls();
}
}

That's it. The only difference between the IntelliGantt Web Part in sandbox mode and the 'normal' IntelliGantt Web Part is the latter is able to plug into the web part editor forms to make it easy to configure all the IntelliGantt Web Part options. In sandbox mode, you'll have to supply all the options yourself in the 'Custom Initialization Parameters' field.

However, we realize that sometimes policy will dicate that the IntelliGantt Web Part is deployed to the SharePoint 2010 sandbox. Here's how to do it.

Friday, February 18, 2011

Filtering SharePoint Task Lists by People and Choices

In the previous blog post we looked about how the IntelliGantt Web Part can dynamically build pie charts when the user selects a choice field. IntelliGantt finds all the choice values and cross references them against every users task assignments. The result is a nice display of everyone's status (for example) across all their assigned tasks, across all the projects you have selected.

Something like this:


Wouldn't it be grand if you could select a user's pie chart and have the task list filtered so that only that user's tasks are shown?

We thought so too, so yes, you can select one or more users and the task list and gantt chart will filtered so that only those users tasks are displayed.

What about the choice values? It'd be nice if you could select those and have the task list filtered so you can quickly see everything that is 'Not Started' or 'In Progress'.

We agree, and you can. Click on any of the choice values and IntelliGantt will immediately filter the tasks.

Finally, the Pièce de résistance, what if you could mix and match the choices and the people so you could see all of Joe and Mary's tasks that are 'Not Started'.

Yes, you can absolutely do that too!

Thursday, February 17, 2011

Charting SharePoint Choice Columns

Choice columns are a great feature in SharePoint in that they let the administrator constrain the 'anything is possible as long as its text' textbox to a predefined list of acceptable values. For a SharePoint task list, the 'status' choice column is a perfect example. Rather than let users type in 'Getting Close' or 'I think I just about got it', users must select from 'Not Started', 'In Progress', 'Completed', 'Deferred' and 'Waiting for someone else'. Of course, more values can be added to a choice column at any time by a site owner.

Here's how the IntelliGantt Web Part works with the choice columns defined in the list settings. As mentioned earlier, 'status' is a powerful choice field for relaying the basic state of a task. IntelliGantt works with the built in status choices to build pie charts for each person (comprised of that person's task assignments) and builds a pie slice for each choice value present.


The choice columns available in this section are controlled by the current view in use. In this example, the 'All Tasks' default view has both 'Status' and 'Priority' choice columns in its list, so these choice columns are available to select. (Note: the 'People' option is something the IntelliGantt Web Part adds if you just want to see people and not pie charts).


The choice columns themselves are defined in the list settings for the task list (or any list, for that matter).


IntelliGantt is completely dynamic in its presentation and pulls column information from SharePoint for its display. So let's add another choice column and see how it appears in IntelliGantt. After clicking on the 'create column' link in the list settings we can name and type our new column:


Next we will provide the values and add some formatting information:


Note that made 'North' the default choice and added this column to the default view. When we return to the IntelliGantt Web Part, once it has refreshed, we will see this choice available.


The 'Region' column is now available in the charting pane and has been added to the Task Grid as well. When we select the 'Region' column in the charting pane its values populate below it. Notice that North is in bold. This is because North is the default value.


The pie charts themselves are not very exciting at this point because, since this is a new choice column, none of the tasks have any region values. Let's add some.


Of course, choices aren't set in stone. Sometimes they need to be updated. Because IntelliGantt is so dynamic it handles this case as well. Let's go back to the region column definition in our list settings and add the most important region of all-- Northwest!


When IntelliGantt refreshes it will recognize the new value and add it to the option list for the 'Region' choice.


Thus, when we update a task with this new value, the other visuals will be updated as well.


The pie slices use IntelliGantt's default color palette, which starts out with similar colors so the Gantt chart doesn't look like a Christmas tree. You can change the default color palette, or you can designate a specific choice field to use a custom palette. How to change colors is covered in detail in our forum.

How to set the Initial Timescale of the Gantt Chart

January 2015 Update for IntelliGantt for SharePoint 2013.

A customer requested that the IntelliGantt Web Part's initial timescale be adjustable when it first appears. It's just a bit of math to generate the time scale so we were happy to oblige. We introduce the 'Zoom Factor'.

It's the ultimate in precision, especially for you engineering types, as it literally is the zoom factor being used to display the Gantt Chart. By default, the zoom factor is 1.0. If you moved the slider, it will range between 0.075 and 1.925. (the range wasn't always so wide-- another user requested we make it wider, so we did).

Now when you set the zoom factor the gantt will compress or expand time appropriately (what a feature!), and the slider will change to the correct position.

More Gantt and Task Status Color Options

We updated the custom color system for the IntelliGantt Web Part to help our users in three ways:

1) An easy way to change Status specific colors.
2) A way to define your own custom palette.
3) A way to define a custom palette to be used with a Choice field of your choosing.

Here's a shot of the custom colors in action with the KPI pie charts:


Here is our forum post with all the details.

Wednesday, February 16, 2011

Filter Basecamp Todo Items by Person and by Status

As of build 1.0.70 the IntelliGantt Web Part for Basecamp offers an easy way to quickly filter your Basecamp Todo Items by who is assigned and its current status. This also means we've introduced a 'Status' field to Basecamp Todo Items with the following choices: Not Started, In Progress, Completed, Deferred and Waiting for someone else.

I know when I first start explaining this feature to folks it run a little dry. Thankfully, 37 Signals provided an extra bit of data to make it fun. Every Basecamp user has information about themselves they can provide, including an avatar url. We thought this such a great idea we incorporated it into the product:


At the bottom of the picture is our new 'People' pane. You can see that three people have actual photos in their avatar uri and two people do not, so they get the general stock image. Because 'Unassigned' is much more a concept than a person, it gets a special generic, non-descript bulbous person icon.

The idea here is not only to show who is involved with what project, but also to enable quick filtering of a persons tasks. How to do this? Click on the person (or the 'Unassigned). The task grid and gantt instantly filter the list so that only tasks assigned to the selected person are displayed. You can select addition people and their assigned tasks will pop into view as well. Unselect everyone to return to the full list.

The other thing to notice in this pane is the dropdown control at the left. This let's you select either the default view of people (with pictures) or two additional fields: Status and Priority.

When you select Status or Priority, the pane changes a bit. Instead of people with the number of tasks assigned to them, you will see a pie chart reflecting a breakdown of that persons Status or Priority choices for all their assigned tasks:


Similar to selecting people, when you select one of the choices in the list (like 'Not Started'), the task list and gantt chart immediately update so that only items matching the choice selection are in the view. You can select multiple choices (ie. 'Not Started' and 'In Progress') to apply at once. Futhermore, you can still select a person or two by clicking on a pie chart to get really granular. As before, simply unselect everything to go back to the default view.

We have detailed examples of these steps for filtering by people and by choices on our site. Better yet, we have a fully functional 15 evaluation available so you can try our IntelliGantt Web Part for Basecamp today.

Sunday, February 13, 2011

One Challenge for SharePoint? Inadequate Interfaces

CMSWire recently posted an interesting article about SharePoint adoption and the five biggest challenges to further growth. The first interesting nugget is SharePoint 2010 deployment is roughly equal to SharePoint 2007 deployment. As a someone building solutions for SharePoint 2010 and 2007, a growing market is a good thing.

More directly important for us, however, is one of the issues facing SharePoint (as cited by the article):
76% of those surveyed said that the interfaces were only adequate or even inadequate for their needs
.

We firmly believe one of those areas is Project Management and specifically the Task List. So it's not too surprising that the response to our IntelliGantt Web Part technology for SharePoint has been particularly strong. We've taken many years of experience, volumes of customer feedback and the latest technology and distilled these ingredients into a Gantt chart that at least 76% of SharePoint users will appreciate.

Things like:

Two Clicks to install the product
Feedback from every clickable image
Clickable arrows that bring off-the-screen tasks quickly into view
Native Drag and Drop for attaching files to tasks
Changing the Gantt timescale with a simple slider
Dynamic refreshing for up to the minute data
One click Item or Summary task creation and removal
Rich printing with user defined start and end dates
Explorers for combining multiple task lists into one view

and even more features to be available this week!

I can't see we knew exactly how many folks would benefit from our improved interfaces when we started down the SharePoint road. It's nice to see there's more than a few.

Friday, February 11, 2011

Key Performance Indicators - People and Choices

Folks have been asking about Key Performance Indicator (KPI) enhancements within the IntelliGantt Web Part since its inception and we're happy to report it's almost here.

Here's a 'thousand word picture':


Basically we are introducing an expandable region at the bottom of the Task Grid and Gantt Chart that shows choice fields and people. What task you select determines the list of choices and people you see.

For example, if you select the topmost 'task', which can contain multiple projects, you see all the people across all the projects. This is a nice way to see a global rollup.

If you select a particular project, then the number of visible people is narrowed to just those within the project. This can be helpful if you want to drill down on a single project.

Similarly, the available choices change depending on your task selection. At the broadest selection only Status and Priority are available. However, when you click on a task or summary task within a project, then all the choice fields from the current view become available.

As you can see, all that information can then be distilled into useful pie charts reflecting each persons allocation choice values (ie. Not Started, In Progress or Completed for the Status choice).

The coolest part? Watching the pie charts dynamically refresh as new data automatically is retrieved.

Lot's more information coming. We're so excited we just had to share a peek.

Wednesday, January 12, 2011

Viewing SharePoint Data Lists in a Gantt Chart

It's great when tools can work with well-structured data in well-defined lists like Tasks, Events and Discussions. But what about the other 99% of the data out there? You know, the stuff that started in Excel and was then uploaded to a SharePoint Custom List. It would have been nice to clean the data up and put it into a task list, but that's more work than people should be required to do.

Rather, in a perfect world, a tool should be able to work with the hodge-podge of data that reflects our daily routine and aid in making sense of it.

We couldn't agree more.

Therefore, we designed the IntelliGantt Web Part to work not only with SharePoint Task and Project Lists, but with just about any list, including the least structured of all-- Custom Lists. This gives you the ability to work with the unruly but critical data already in use today and adds a dash of structure to help you organize a collaborative effort so you can finish tomorrow.

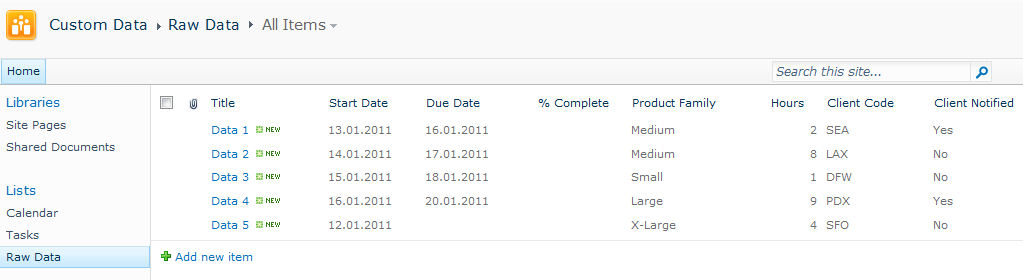
Take, for instance, this basic Custom List called 'Raw Data'. It probably came from a spreadsheet somewhere long forgotten.


That 'Client Notified' field indicates there's probaly some work behind updating these rows of data. It'd be great if we could lay it out in a real task oriented tool like the IntelliGantt Web Part.


Ideally, we would like to place the 'Raw Data' right into the task list as an additional project to view:


Happily, you can do just that!

First, we need to inform the IntelliGantt Web Part of the new list type we want to use. Every SharePoint list has a template id. In the Web Page Editor, the IntelliGantt Web Part has a text field you can add one or more template ids into.


The template id for a Custom List is "100", which makes me think it might have been the first list the SharePoint team ever created. We will add "100" to the field.


Click 'OK' to save your changes and when the IntelliGantt Web Part refreshes, lo and behold!


First, IntelliGantt Web Part found the 'Raw Data' because it matched the template id. Then it adapted to the data and view on that list and updated the column headers of the task list to match.

But we're not done yet. It's time to add our dash of structure to the mix. What we will do is add a few more fields and start whipping this data into shape.

First, let's go back to the 'Raw Data' list and open the List Settings.


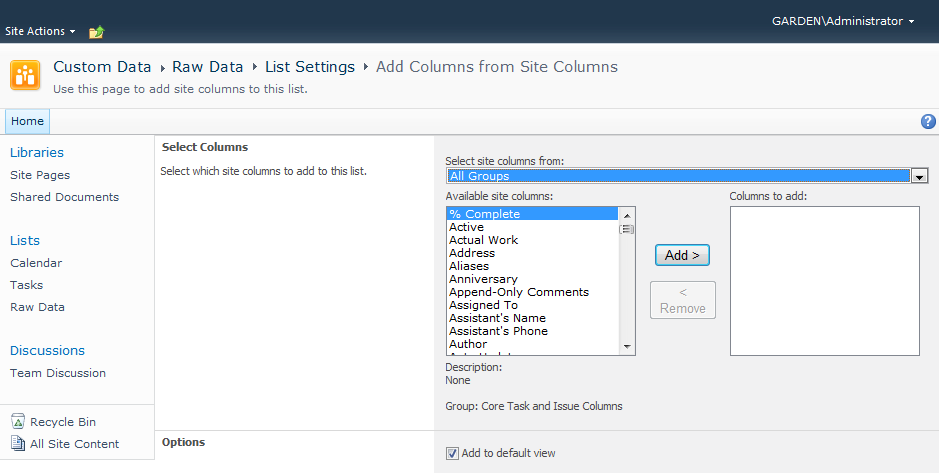
Scroll down to the 'Columns' section in the List Settings. Here is where we can either add new columns or use columns already defined by SharePoint.


Why reinvent the wheel, right? Therefore let's go to the 'Add from existing site columns' and see what we find.


Looks like '% Complete' is at the top of the list. We can use that. And we will look for 'Start Date' and 'Due Date' as well.


Click 'OK' to add them and, upon return to the List Settings page, you should see these columns are now available in the 'Raw Data' Custom List.


While they where automatically added to the default view, let's change the order of the columns so we see the Start Date, Due Date and % Complete columns first.


OK, that wasn't too bad. Let's see what our IntelliGantt Web Part looks like now.


Excellent! Since this is a 'task aware' tool, we can quickly add a bit more structure to really help organize our data. For example, we can flesh out the Start and Due dates.


There, we've quickly applied a little bit of project management discipline to a formerly unstructured mess. Better yet, we did not have to examine and update each row of data in order to shoehorn it into an inflexible system. Instead, we brought a flexible (IntelliGantt!) system to the data and solved the problem.

By the way, everything is being stored in SharePoint and the simple updates we did to the Start and Due dates were saved in the 'Raw Data' Custom List.


If you have an unruly SharePoint dataset needing a bit of order, give the IntelliGantt Web Part a try today.

Tuesday, January 11, 2011

Trimming a Full Hierarchy with a Collapse Level

Because one of our design goals is being able to show you the whole picture, the IntelliGantt Web Part by default will show you all the tasks in any SharePoint Task List. All the summary tasks and their subtasks will be added to the current view in a beautifully full project hierarchy. Want to see all the subtasks of a folder 5 levels deep? No problem.

But what if you just want to see the first level of folders in order to get a quick sense of how long things in general are taking? And to get a quick view of the current progress and status? If you have multiple, fleshed out projects in the view together, collapsing the higher level summary tasks can be a useful way to see the 'bigger picture' before diving into all the details.

Since more than a few customers have requested this fature, we're happy to introduce the Collapse Level. Basically, you tell IntelliGantt how many levels to show in the hierarchy before summary tasks are 'collapsed' (i.e., do not show their sub tasks).

For example, here is a very simple project that contains a couple summary tasks with sub tasks.


Note that Food Group 1 and Food Group 2 are 'expanded'. You can change this be setting the Collapse Level via the web part editor page:


We will put in the number '3' which will expand things down to the first level of summary tasks. If you want to see more subtasks before collapsing summary tasks, use a larger number. If you don't even want to see the top-level summary tasks, use a smaller number.


When you click 'OK' and the IntelliGantt Web Part is refreshed, now the first level of folders will still appear but they not expanded.


The subtasks are still there of course. Just click on the expand/collapse indicator to the left of the folder to start burrowing.

Quickly Adding and Removing SharePoint Tasks

Raise your hand if you like filling out SharePoint Task List forms (or any form, for that matter).

While SharePoint item forms are powerful and flexible, they also require one click to bring up the form dialog, at least one typed character for every required field and a second click to save the form item. Additionally, if you wish to add an item to a folder, you need to click on the folder to establish a new view and then do the pre-requisites above. If you are working with an actual project hierarchy, filling an outline of all the levels quickly becomes burdensome.

Or you can use your mouse and our IntelliGantt Web Part. Because the web part shows you the complete hierarchy, there are no context switches. Simply move the mouse over the row you want to add tasks or summary tasks to and click the '+' sign. If you want to remove a task or summary task, click the '-' sign.

Here's how it works in pictures.

Below is an empty SharePoint Task List presented in the IntelliGantt Web Part.


If you have sufficient privileges (ie. you are an Administrator or the 'Edit Schedule' setting is enabled), when you move the mouse over the left side of the task list a special column will appear. It's similar to the 'Add Attachment' column that appears when you drag and drop files. Only this time instead of the upload arrow, you see a '+' sign and/or a '-' sign, depending on what row your mouse is over.


Here we only have the option to add because the mouse is over the actual Task List row. You can click on the '+' sign to add a task:


Or you can hold down the SHIFT key and click to add a folder:


When you move the mouse over a summary task, you have the option to add subtasks or remove the folder. You can add multiple tasks quickly by clicking multiple times:


Finally, you can remove tasks or summary tasks by clicking on the '-' sign.


Again, you can click multiple times to remove multiple tasks (or you could remove the summary task, which in turn removes all its subtasks). Once your mouse is no longer over an item that can be added to or removed, the 'no can do' symbol appears:


We believe this makes it much easier to quickly add and remove tasks and summary tasks to your SharePoint Task List as efficiently as possible, which helps you be more productive.