
What is the most important thing to make flexible in a Gantt Chart? We think it has to be the timeline. As such, based on our earlier work, we keep the same, fluid interactive zoom in and zoom out feature that users love. Whether by mouse or by finger you can grab a slider and zoom the timescale (the horizontal version of the Gantt Chart) from hours to years. (Yes, construction folks, years. We heard plenty of feedback on how long your projects can be and therefore how much scale is needed).
Typically this timescale zooming is along the X-Axis, or your horizontal view. Given that all 2-D projections have a Y-Axis as well it seemed a shame not to use it. So we thought some on what would be useful if a user zooms things vertically? Given that a major design objective was being adaptable to multiple platforms and devices, the answer, we believe, is font size-- or what is displayable per row. Yes, if you rotate your device we can resize the XY of the Gantt Chart, but that doesn't mean we know the pixel density of the device and what is the best viewing. So we provide the same fluid, interactive slider vertically to adjust your font size for your display.Let's see how this works. Here is our initial scale:

You can grab the right bottom slider and move it left:

Or you can move it right:

The timescale will adjust as you'd expect. Now what happens when we move the right vertical slider up and down? You will see the font size change. For example, if you want to compress the rows to fit as many as possible in your view, move it up:

If you want to make the rows 'taller' so you can read them easier, then move the slider down:

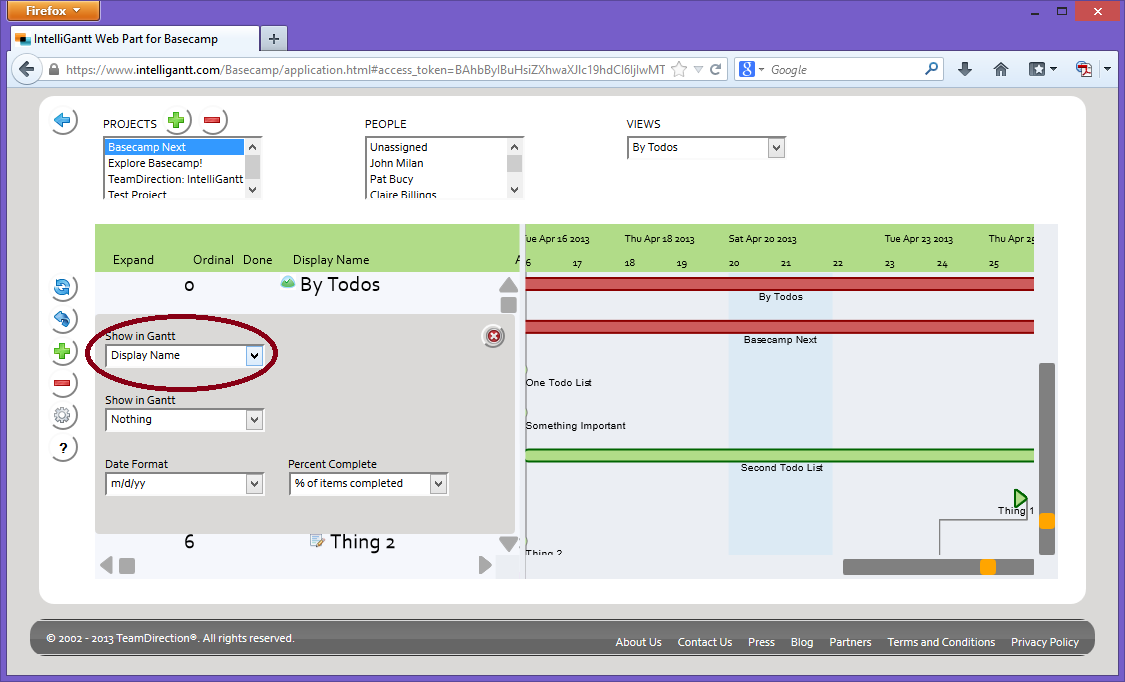
Finally, we noticed lots of space in the Gantt Chart when the vertical slider is down a ways. So we put in an option to show fields from your tasks right in the Gantt. You choose the fields, we display them with the task. On the left had side of the chart we click the 'Configure' button that brings up our options:

We can put 'Display Name' in the first slot:
And maybe the Due Date in the second slot:

We think the result is a Gantt Chart that can scale both to your timescale needs and to your eyeball needs.


No comments:
Post a Comment